1Like traditional index funds, direct-indexed accounts are designed to track the performance of a benchmark. But instead of owning shares in a commingled vehicle like an ETF or mutual fund, investors own many of the underlying securities that comprise the index in a separately managed account (SMA). This direct ownership allows investors to tailor their portfolio in a number of ways to suit individual preferences and needs.
Glossary
Beta is a measure of the volatility, or systematic risk, of a security or portfolio in comparison to the market.
Equity duration measures the sensitivity of an equity price to changes in the discount rate.
Mean is a measure of central tendency of a probability distribution. It refers to an expected value of a data set.
Pair-wise trade refers to a transaction that seeks to identify two companies or funds with similar characteristics whose equity securities are currently trading at a price relationship that is out of their historical trading range.
The S&P 500 Index is the Standard & Poor's 500 Composite Stock Prices Index of 500 stocks, an unmanaged index of common stock prices. The index figures do not reflect any deduction for fees, expenses or taxes. It is not possible to invest directly in an unmanaged index.
Tax-Alpha refers to the potential value created by the effective tax management of investments.
Tracking error refers to the divergence between the returns of a position or a portfolio and the returns of a benchmark.
Volatility is a measure for variation of price of a financial instrument over time.
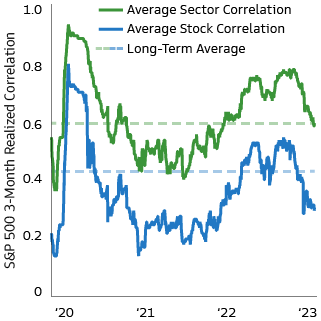
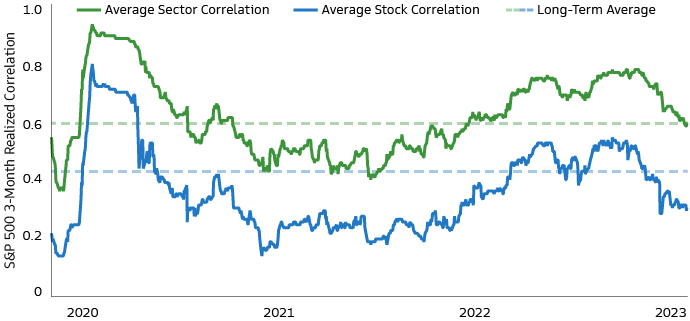
Correlation is a statistical measure that indicates the extent to which two or more variables fluctuate in relation to each other.
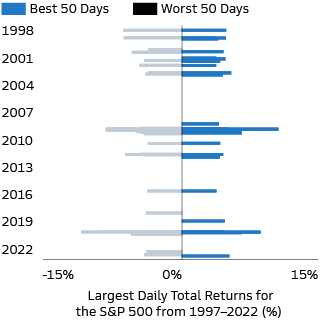
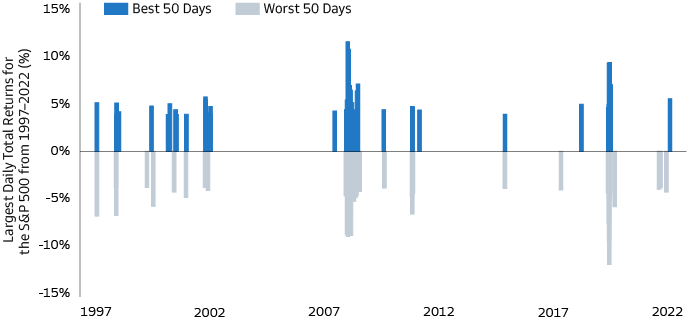
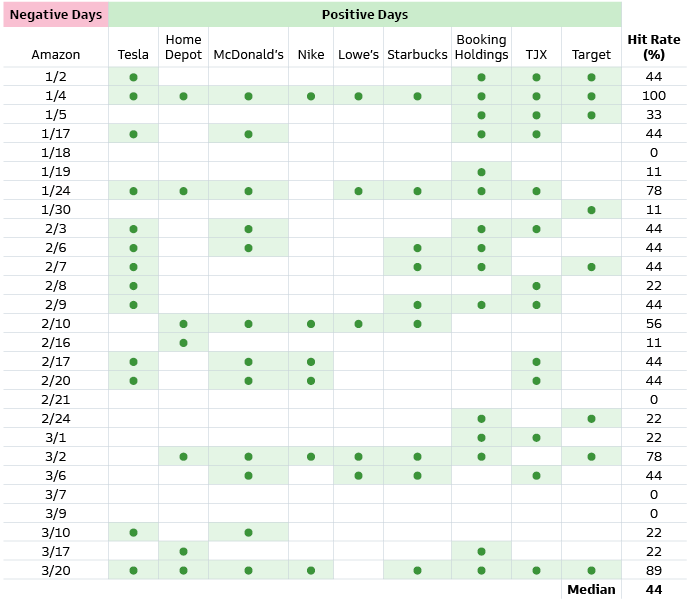
Negative Days refer to negative daily performance.
Risk Considerations and General Disclosures
Equity investments are subject to market risk, which means that the value of the securities in which it invests may go up or down in response to the prospects of individual companies, particular sectors and/or general economic conditions. Different investment styles (e.g., “growth” and “value”) tend to shift in and out of favor, and, at times, the strategy may underperform other strategies that invest in similar asset classes. The market capitalization of a company may also involve greater risks (e.g. "small" or "mid" cap companies) than those associated with larger, more established companies and may be subject to more abrupt or erratic price movements, in addition to lower liquidity.
Although certain information has been obtained from sources believed to be reliable, we do not guarantee its accuracy, completeness or fairness. We have relied upon and assumed without independent verification, the accuracy and completeness of all information available from public sources.
Individual portfolio management teams for Goldman Sachs Asset Management may have views and opinions and/or make investment decisions that, in certain instances, may not always be consistent with the views and opinions expressed herein. Views and opinions expressed are for informational purposes only and do not constitute a recommendation by Goldman Sachs Asset Management to buy, sell, or hold any security. Views and opinions are current as of the date of this commentary and may be subject to change, they should not be construed as investment advice.
This information discusses general market activity, industry or sector trends, or other broad-based economic, market or political conditions and should not be construed as research or investment advice. This material has been prepared by Goldman Sachs Asset Management and is not financial research nor a product of Goldman Sachs Global Investment Research (GIR). It was not prepared in compliance with applicable provisions of law designed to promote the independence of financial analysis and is not subject to a prohibition on trading following the distribution of financial research. The views and opinions expressed may differ from those of Goldman Sachs Global Investment Research or other departments or divisions of Goldman Sachs and its affiliates. Investors are urged to consult with their financial advisors before buying or selling any securities. This information may not be current and Goldman Sachs Asset Management has no obligation to provide any updates or changes.
THIS MATERIAL DOES NOT CONSTITUTE AN OFFER OR SOLICITATION IN ANY JURISDICTION WHERE OR TO ANY PERSON TO WHOM IT WOULD BE UNAUTHORIZED OR UNLAWFUL TO DO SO.
Economic and market forecasts presented herein reflect a series of assumptions and judgments as of the date of this document and are subject to change without notice. These forecasts do not take into account the specific investment objectives, restrictions, tax and financial situation or other needs of any specific client. Actual data will vary and may not be reflected here. These forecasts are subject to high levels of uncertainty that may affect actual performance. Accordingly, these forecasts should be viewed as merely representative of a broad range of possible outcomes. These forecasts are estimated, based on assumptions, and are subject to significant revision and may change materially as economic and market conditions change. Goldman Sachs has no obligation to provide updates or changes to these forecasts. Case studies and examples are for illustrative purposes only.
This material is provided for educational purposes only and should not be construed as investment advice or an offer or solicitation to buy or sell securities.
Goldman Sachs does not provide legal, tax or accounting advice, unless explicitly agreed between you and Goldman Sachs (generally through certain services offered only to clients of Private Wealth Management). Any statement contained in this document concerning U.S. tax matters is not intended or written to be used and cannot be used for the purpose of avoiding penalties imposed on the relevant taxpayer. Notwithstanding anything in this document to the contrary, and except as required to enable compliance with applicable securities law, you may disclose to any person the US federal and state income tax treatment and tax structure of the transaction and all materials of any kind (including tax opinions and other tax analyses) that are provided to you relating to such tax treatment and tax structure, without Goldman Sachs imposing any limitation of any kind. Investors should be aware that a determination of the tax consequences to them should take into account their specific circumstances and that the tax law is subject to change in the future or retroactively and investors are strongly urged to consult with their own tax advisor regarding any potential strategy, investment or transaction.
The cost basis of a tax loss harvesting portfolio is driven down due to the realization of capital losses, creating a contingent tax liability. For investors who will eventually bequest their tax loss harvesting portfolio to charity or to their heirs upon death, taxes on the unrealized gains are generally avoided. However, if the tax loss harvesting portfolio is liquidated, the investor will pay taxes on the realized gains upon liquidation. After-tax calculations include realized losses incurred by the portfolio but do not account for unrealized gains. If the portfolio is neither gifted nor bequeathed, the investor will pay taxes on the realized gains upon liquidation, which will affect after-tax returns.
References to indices, benchmarks or other measures of relative market performance over a specified period of time are provided for your information only and do not imply that the portfolio will achieve similar results. The index composition may not reflect the manner in which a portfolio is constructed. While an adviser seeks to design a portfolio which reflects appropriate risk and return features, portfolio characteristics may deviate from those of the benchmark.
Index Benchmarks
Indices are unmanaged. The figures for the index reflect the reinvestment of all income or dividends, as applicable, but do not reflect the deduction of any fees or expenses which would reduce returns. Investors cannot invest directly in indices.
The indices referenced herein have been selected because they are well known, easily recognized by investors, and reflect those indices that the Investment Manager believes, in part based on industry practice, provide a suitable benchmark against which to evaluate the investment or broader market described herein.
Past performance does not guarantee future results, which may vary. The value of investments and the income derived from investments will fluctuate and can go down as well as up. A loss of principal may occur.
Date of First Use: April 27, 2023. 314043-OTU-1777350.