


November 8, 2022 |
Muni Market Views
Menu
Our services in the selected location:
- No services available for your region.
Your browser is out of date.
-
In The Spotlight
Alternatives - Private Credit
Investing globally and across the capital structure, our private credit platform combines deep expertise and long-standing relationships with high caliber sponsors globally with the goal of identifying attractive risk-adjusted return opportunities across the credit spectrum.Read More -
-
- By Asset Class
-
Fixed Income
-
Equities
-
Alternatives
In The Spotlight
Perspectives
In this edition of Perspectives, we explore how investors can seek out potential opportunities across public and private markets as confidence in the macroeconomic outlook continues to build.Read More -
-
- Product Collateral
-
Product Brochures
-
Investment Solutions
-
Fact Cards
-
Fund Commentaries
-
- Documents and Forms
-
Tax Information
-
Forms & Applications
-
Regulatory Documents
-
All Documents
In The Spotlight
Our In-Depth Commentary Could Help You Gain a Competitive Edge
Read MoreStay on top of the latest market developments, key themes, and investment ideas affecting your portfolio and practices.
-
-
-
- About Us
-
Overview
-
News and Media
-
Contact Us
-
-
Explore how we can help you
Contact UsAFTER A BRIEF SUMMER RALLY, YIELDS SURGE TO HIGHEST LEVELS IN OVER A DECADE
Muni Market Quarterly
3Q 2022 | 10 Minute Read
Executive Summary
Municipals began the quarter with positive returns that were supported by robust summer technicals and a rally in Treasury yields. The momentum, however, would be short-lived as August and September saw sharply negative returns with yields surging globally. The tax-exempt muni market, as represented by the Bloomberg Municipal Bond Index, returned -3.46% over the three months ending September 30th, 2022. The Bloomberg High Yield and Taxable Municipal Indices returned -4.83% and -6.18%, respectively, during the third quarter of 2022.
Higher yields, brought upon by strong employment data and inflation readings that surprised to the upside, drove negative performance. The Fed delivered multiple 75bp rate increases during the 3rd quarter and its members continuously reiterated their intention to raise interest rates as much and for as long as needed in order to combat high levels of inflation.
Municipal benchmark yields across the curve finished the quarter at their highest levels of the year and at levels not seen in over 10 years. Bloomberg 3yr Index at 3.41% (highest since 2008), Bloomberg 1-10 Index at 3.55% (highest since 2009), and Bloomberg Muni Agg Index at 4.04% (highest since 2011).
I. Market Review
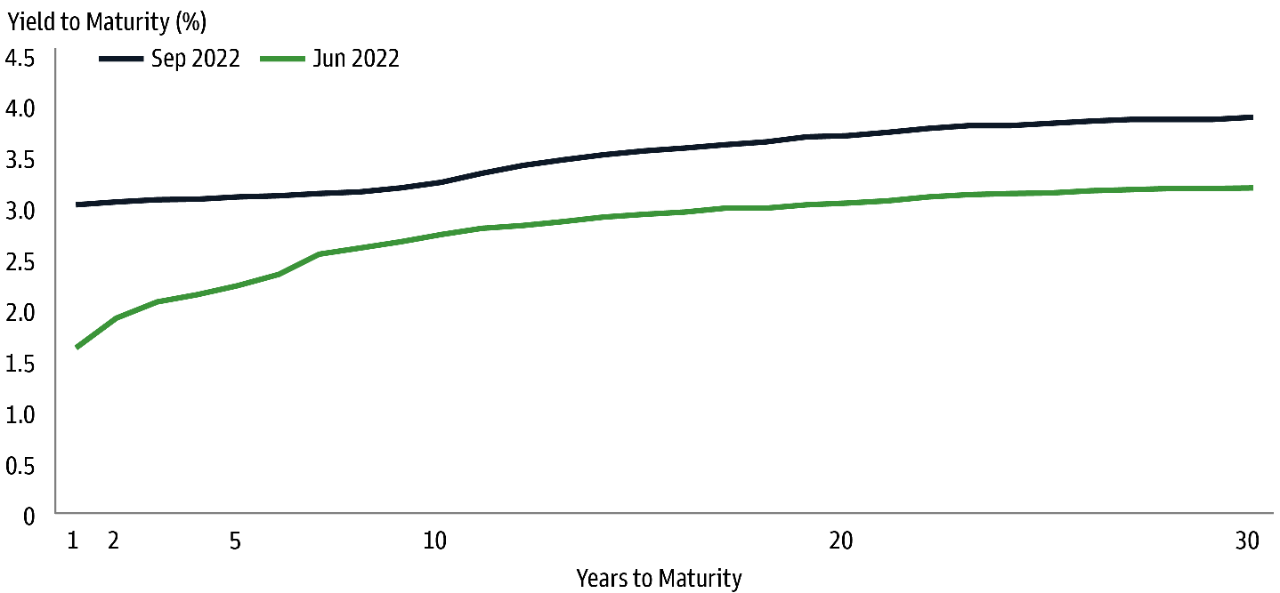
Exhibit 1: Q3 2022 Treasury vs Municipal Yield Shifts

Source: Bloomberg, BVAL Muni. As of September 30, 2022.
Primary Market: Interest Rate Volatility Mutes Supply to Lowest Quarterly Total of the Year
TQ3’22 supply volume was considerably lower than Q3‘21. Interest rate volatility increased with rising Treasury yields and made taxable refinancing uneconomical for issuers. New issue volumes were 25% lower than Q3’21 and 15% below Q2 of this year. Q3 volumes were the lowest of the year so far.
Each month’s volumes were lower on a year-over-year basis. The month of September stood out in particular as volumes were 40% lower than September 2021. This is notable as issuance during the fall typically accelerates after a summer slowdown. Market-moving events, however, such as inflation readings and Federal Reserve decisions lowered volumes. Issuers generally prefer more stable markets when bringing deals and typically look to avoid periods of extreme volatility.
Exhibit 2: Municipal Issuance

Source: Bloomberg, Bond Buyer. As of September 30, 2022.
Demand: Less Severe Fund Outflows Extend Largest Outflow Cycle on Record
Municipal fund outflows were relatively muted compared to the second quarter due to the summer rally. Outflows did however accelerate as the quarter came to an end. For the 3rd quarter, fund outflows totaled $14BN — a better result than the $54BN that flowed out of the municipal mutual fund complex during the previous quarter. Year-to-date outflows of more than $90BN have largely reversed a large percentage of the record $100BN of inflows that municipal funds received during 2021.
Fund flows appeared to have turned a corner after a furious municipal bond rally that extended from mid May to the end of July. In August, however, investors began to look ahead to the fall — a time of the year that is generally less technically robust for municipals. Market weakness was further exacerbated by expensive valuations and the rapid rise in yields seen in September. Both dynamics paved the way for an increase in outflows as the quarter wound down.
Exhibit 3: Municipal Fund Flows

Source: Lipper. As of September 30, 2022.
Exhibit 4: Municipal Holdings by Investor Type

Source: Federal Reserve Board Flow of Funds data, BofA Merrill Lynch Global Research. As of 2Q22, latest available.
Valuation/Yield Changes: Municipals Generally Underperformed as Yields Rose
Triple-A tax-exempt muni yields generally continued their climb upward throughout the quarter. The quarter did start out on a positive note though as yields fell 40bps on average during July. As August arrived, yields began to rise again — moving higher by 50bps on average. In September, yields rose close to 70bps as a hawkish Fed increased rates by 75bps for the third consecutive meeting and heightened inflation drove global yields higher. Short yields generally exhibit the most sensitivity to Fed hikes and rose ~100bps.
AAA tax-exempt municipal yields increased 114/87/51/69bps in 2/5/10/30 year tenors while Treasuries increased 132/105/81/59 in the same maturity spots on the curve. Muni/UST ratios were mixed, with 2/5/30 year ratios higher by 7/2/3 percentage points, while 10 year ratios were lower by 6 percentage points.
Yield Curve: Flattened as Short-Term Yields Rose Double the Amount of Long Term Yields
The tax-exempt municipal yield curve flattened over the quarter as shorter maturity bonds experienced a greater increase in yields, while the longest maturities increased to a lesser extent. At one point, the municipal yield curve inverted as 1 and 2 year maturities had higher yields than 4 and 5 year maturities. An inversion is a much rarer phenomenon in the muni market versus Treasuries.
The difference between 2 and 30-year tax-exempt muni yields decreased by 45bps to end the quarter with a slope of 83bps. The middle of the curve, represented by 5 to 10-year maturities, flattened by 36bps and finished with a slope of 14bps.
Exhibit 5: Municipal Yield Curve
Source: BVAL Muni. As of September 30, 2022.
Investment Grade Index Returns & Spreads: Negative Returns as Spreads Tighten
The Bloomberg Municipal Bond Index returned -3.46% during 3Q’22. The 1-10 year Blend Index posted a total return of -2.30%, while the 3 year Index returned -1.98%. Within investment grade credit, the ‘AA’ portion of the muni index had the best relative returns (-3.34%), and from a curve perspective, the 1 year Index (1-2 year) performed the best with a return of -1.12%.
BBB-AAA credit spreads tightened by 3bps to end the quarter at 112bps. This compares to 43bps of widening that occurred during the second quarter. State of New Jersey appropriation (BBB-rated) credits saw their rating outlooks revised to positive during the quarter.
High Yield Municipals: Tighter Spreads as Resiliency Continues
The high yield municipal market, as represented by the Bloomberg Municipal High Yield Index, posted a negative return of 4.83% over the quarter, underperforming the investment grade index by 137bps. This was high yield’s third consecutive quarter of underperforming investment grades.
Within high yield municipals, resource recovery credits were the best performers, posting a total return of 1.85%. Transportation and Puerto Rico credits were underperformers, returning -7% each over the quarter. Within the high yield municipal index, the shortest maturity (1 year) outperformed by returning 0.47% while the longest maturity (22+ year) underperformed at -6.50%. Underperformance was driven by the structurally longer duration of this portion of the municipal market. High yield municipal funds experienced outflows over the quarter, but they were more muted than previous quarters.
High yield spreads decreased by 10bps on the quarter and ended September at 199bps — this was a reversal from the second quarter where spreads widened by 40bps. Spreads were able to move lower due to an easing of selling pressure during the third quarter as compared to the second quarter. Like most muni fund categories, high yield municipal funds had significantly lower outflows to contend with. So far this year, high yield and non-rated spreads continue to be more resilient than their corporate counterparts as the major sectors of the muni market are seen as less economically sensitive to a potential recession.
Exhibit 6: Municipal Index Spreads

Source: Bloomberg. As of September 30, 2022.
Taxable Municipal Market: Underperforms Tax-Exempts due to greater Treasury Yield Sensitivity and Wider Credit Spreads
The taxable municipal market, as represented by the Bloomberg Taxable Municipal Index, posted a total return of -6.20% during the quarter. Negative returns were driven by longer maturity exposures and overall duration. Credit spreads widened by 13bps as the spread of the Bloomberg Taxable Municipal Index to the 10 year Treasury ended the quarter at 140bps. Taxable municipal new issuance remains almost 50% below last year’s pace as higher Treasury yields inhibited refinancing activity.
Market Statistics
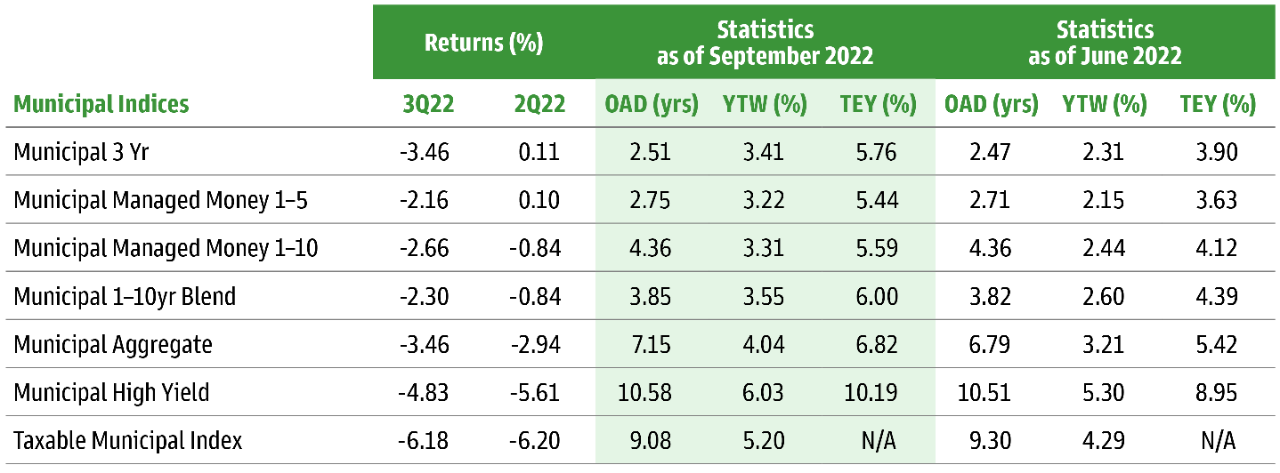
Source: Bloomberg, Goldman Sachs Asset Management. As of September 30, 2022. OAD: “Option adjusted duration” is a measure of the sensitivity of a bond's price to interest rate changes, assuming that the expected cash flows of the bond may change with interest rates. YTW: “Yield to worst” is calculated by making worst-case scenario assumptions (excluding issuer default) on the bond by calculating the returns that would be received if provisions, including prepayment, call, put, and sinking fund, are used by the issuer. YTW may be the same as YTM, but never higher. YTW does not represent the performance yield for the Fund. TEY: “Taxable equivalent yield” is the return that is required on a taxable investment to make it equal to the return on a tax-exempt investment. Past performance does not guarantee future results, which may vary. Goldman Sachs does not provide accounting, tax or legal advice. Please see additional disclosures at the end of this document. Past correlations are not indicative of future correlations, which may vary. Returns less than 12 months are cumulative, not annualized.
II. Municipal Credit Update
Housing’s Impact on Municipal Finance
This year’s run-up in mortgage rates coupled with the multiple years of double-digit percentage gains in housing prices has led to home affordability challenges across the entire country. With home prices in various MSAs now starting to fade somewhat, questions around how property tax revenues might be affected have surfaced given that they account for approximately 30% of local government revenues. Fortunately, property tax revenues tend to be relative stable even during times of economic stress. In fact, property tax revenues managed to grow for a full year while GDP declined at the onset of each domestic recession since at least the early 1980’s. Historically, in the instances where property tax revenues are slated to decline, the timing of when home valuations are set and when property tax bills are mailed out allow municipal management teams to preemptively make budgetary adjustments. Furthermore, a decline in home valuations could be offset by an increase in the tax rate – should the political will exist to take such an action — potentially mitigating or even completely offsetting any sort of drop in property tax revenues. Lastly, with state and local government “rainy day” funds presently at record levels, investment grade municipal bond state and local government credit remains well situated to withstand property tax-related declines should they come to fruition.
Exhibit 7: Property Taxes Lagged US GDP Growth
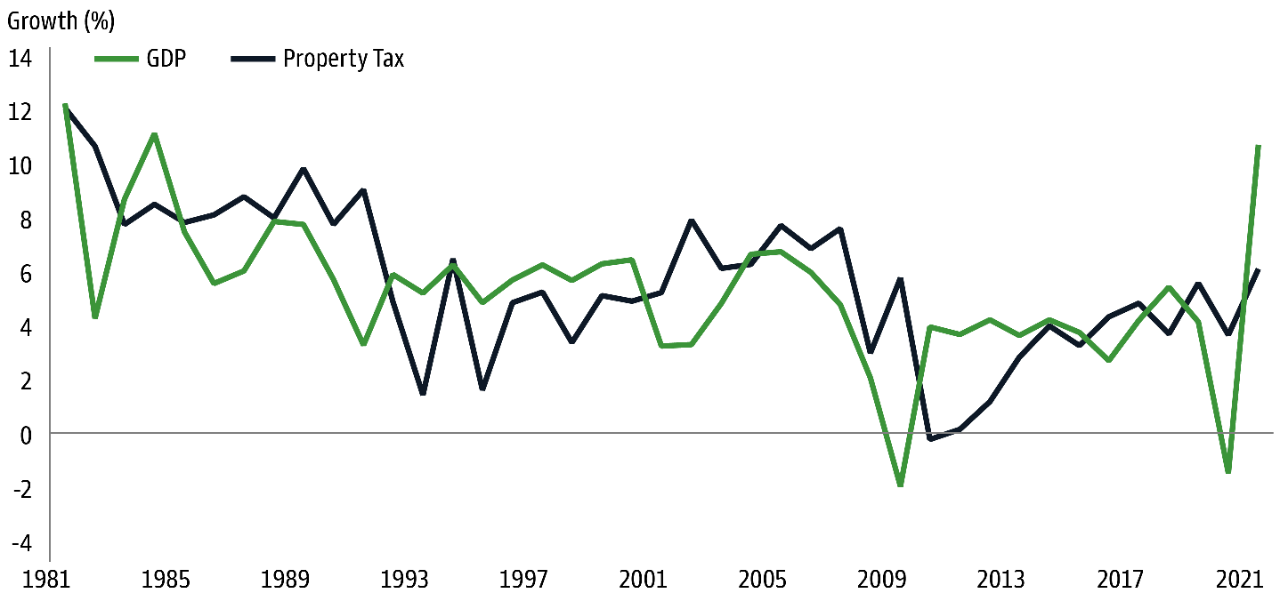
Source: US Bureau of Economic Analysis. As of 4Q 2021, latest available.
Senior Living and Defaults
Senior living transactions — most of which come to market either non-investment grade or non-rated — have been facing financial headwinds on both the revenue and expenditure front. Not-for-profit senior living facilities were 93%-94% occupied on average pre-pandemic whereas nowadays, that figure has seemingly plateaued in the 86%-87% range. At the same time, senior living labor costs have materially increased over the last couple years as hiring qualified workers has become more of a challenging endeavor. The combination of less revenues and higher expenses has resulted in reduced operating margins and lower cash reserves which in turn has resulted in financial strain for the weaker capitalized credits in the sector. While first time municipal bond defaults as a whole have been trending better since 2020, the percentage of said defaults that are senior living bonds now make up more than 70% — up materially from pre-pandemic levels.
Exhibit 8: First Time Municipal Bond Defaults
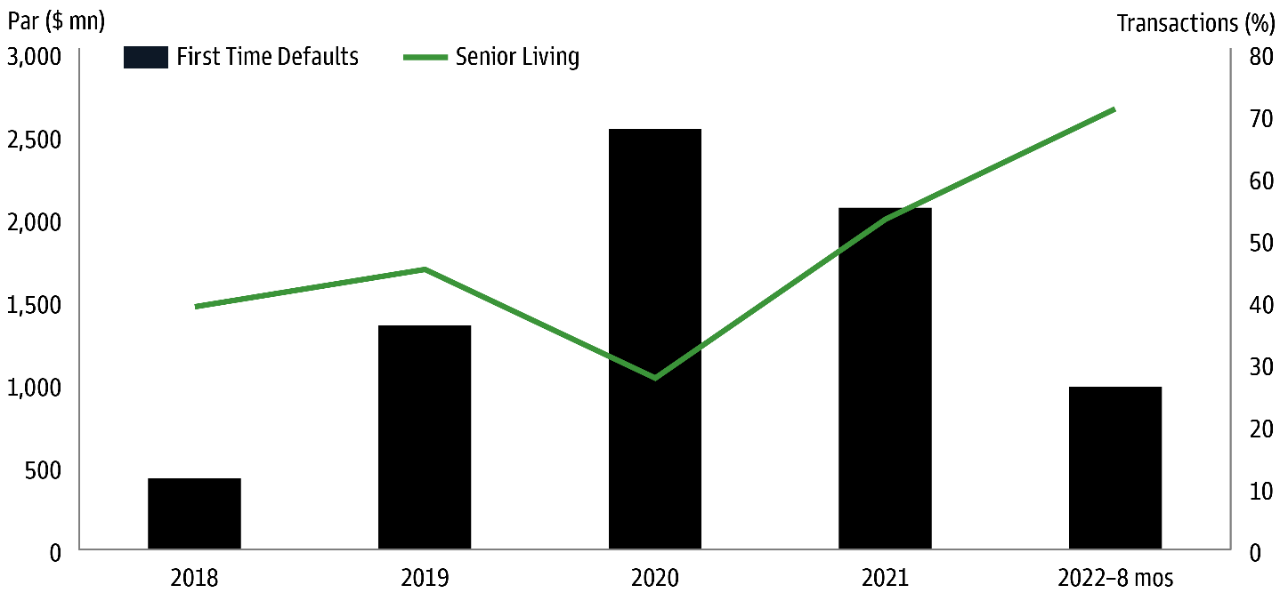
Source: BofA Global Research. As of August 31, 2022
City of Chicago Update
In what has the potential to ultimately be a stabilizing if not uplifting factor to the City of Chicago’s ratings (Ba1/BBB+/BBB-), 2022 marked the first time that the city paid 100% of its Actuarial Determined Contribution (ADC) to its pension funds. Continuing that practice should result in Chicago’s pension fund liability — a major constraining factor to the city’s rating — to decline going forward provided that its pension funds collectively meet their annual investment goals. While the city’s aggregate pension fund investment performance has missed its targets year-to-date, Mayor Lightfoot’s proposed 2023 budget calls for a $242mn supplemental payment above the city’s ADC which should help to mitigate the funding gap created by the aforementioned underperformance.
III. Notable Mentions and Market Movers

IV. Goldman Sachs Asset Management Municipal Market Outlook

- Supply/Demand — We anticipate demand (or lack thereof) will continue to be fueled by the future path of interest rates. Should the next series of inflation readings start to materially decrease enough for the Fed to slow down or stop its rate increases, we could expect to see meaningful inflows into muni mutual funds. If the opposite occurs, the record outflow cycle may continue. We expect new issue supply to continue to be subdued and fall well below initial projections for the year.
- Valuations — Tax-exempt municipal/treasury ratios have significantly increased/cheapened and stand at neutral to slightly cheap valuations. We expect ratios to remain range bound, but they may richen should yields rally as investors look to lock in the highest absolute tax-free yields available in more than a decade.
- Credit & Spreads — Municipal credit continues to show strength, although fundamentals may have peaked as Federal aid subsides and economic growth slows. Given macro uncertainty, we assign a higher probability that spreads widen, but likely not materially. We expect mid-term elections to not be a material event for the market..
Save a copy as a PDF
Municipal Market Quarterly: Not So Fast - Expected Bond Rally Stalls
Related Insights
×
Start the Conversation
Committed to providing you with the insights you need to build your practice.
