


May 11, 2023 |
GSAM Connect
In The Spotlight
In The Spotlight
In The Spotlight
Stay on top of the latest market developments, key themes, and investment ideas affecting your portfolio and practices.
Explore how we can help you
Contact Us2Q 2023 | 12 Minute Read
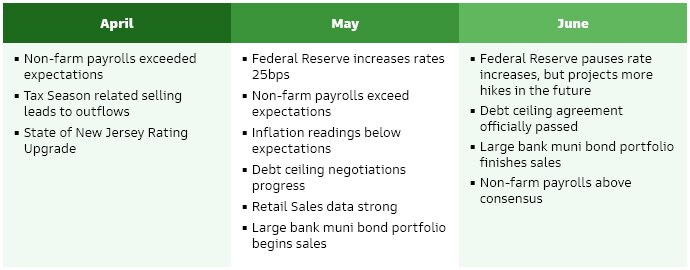
The municipal market had numerous external factors to contend with during the second quarter — aftershocks of the regional banking crisis, tax season, elevated levels of selling by banks, down-to-the-wire debt ceiling negotiations, and a still hawkish Fed. Despite these headwinds, the muni market believed there was light at the end of the tunnel in the form of its annual positive summertime technical backdrop where demand for bonds exceeds available supply.
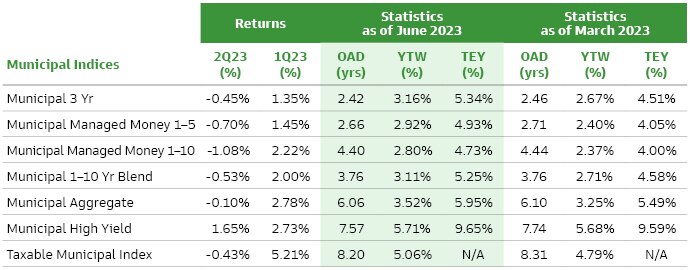
Following negative returns in April and May, anticipated strong seasonals took over and delivered positive performance in June. The Bloomberg Municipal Bond Index, returned -0.10% over the three months ending June 30th, 2023. The Bloomberg Municipal High Yield and Taxable Indices returned 1.65% and -0.43%, respectively, for Q2’23.
U.S. debt ceiling negotiations and the subsequent agreement consumed most of the headlines during the quarter, while better-than-expected employment and economic data coupled with the Fed’s resolve to raise rates to reign in inflation remained consistent themes. Combined, these measures propelled UST yields to end the quarter higher.
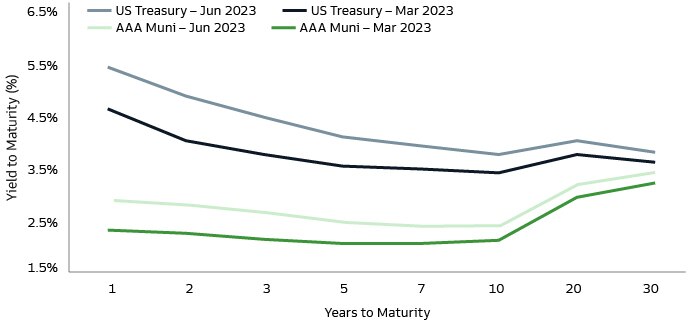
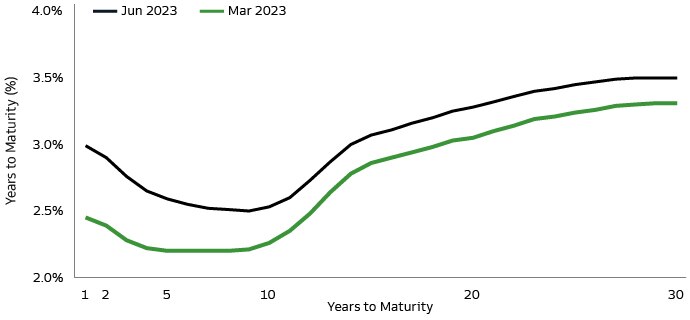
Municipals performed in-line with Treasuries as benchmark muni yields rose across the curve. The Bloomberg 3yr Index ended the quarter 48bp higher at 3.15%. The Bloomberg 1-10 Index closed at 3.11%, 40bp higher, and the Bloomberg Muni Agg Index climbed 27bp, reaching 3.52%.
Source: Bloomberg, BVAL Muni. As of June 30, 2023.
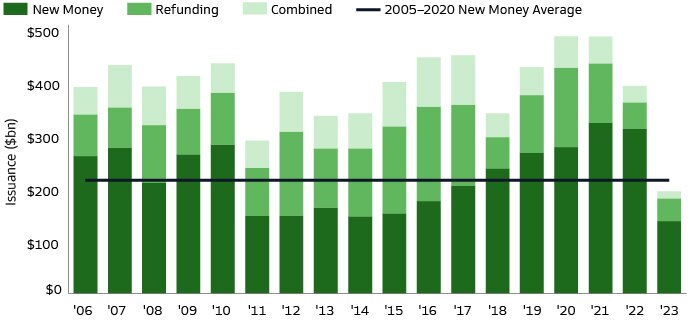
The trend continues — Q2’23 supply volume was considerably lower than Q2’22. Lack of issuance was mainly attributable to subdued refinancing activity and less issuance of new state and local government projects, although uncertainty surrounding the debt ceiling may have also given some issuers pause. Volume was ~15% lower than Q2’22, but ~20% higher than Q1’23.
Volumes were lower on a year-over-year basis for each month within the quarter. April and May were lower by more than 20% versus those months last year. June showed less of a drop — helped by a surge in issuance during the final week of the month. The low level of issuance related to financing new projects has surprised market prognosticators and a central reason why some have significantly cut their volume forecasts from earlier this year.
Source: Bloomberg, Bond Buyer. As of June 30, 2023.
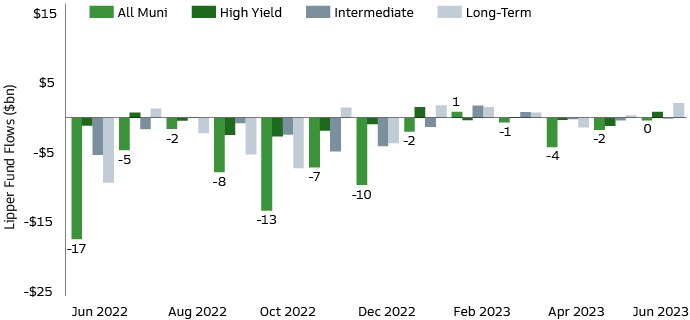
Municipal funds experienced significant outflows to start the quarter — driven by tax liability related selling. Outflows did continue into May, as elevated inflation readings and stronger economic data increased concerns about higher interest rates, however this only amounted to half of the outflows accumulated throughout the month of April. June flows were generally flat as investors looked ahead to positive summer technicals. While Q2’23 resulted in net outflows of $6bn this was still a more favorable result when compared to the $54bn of outflows experienced during the same time last year.
Increased selling, notably the start of a liquidation of a significant municipal bond portfolio from a bank placed into receivership in March, weighed on markets. Initial concerns around market impact, due to the aggregate size and composition of portfolio, did fade however as demand from non-traditional buyers and scheduled timing of the sales led to negligible (if any) impact on the market.
Source: Lipper. As of June 30, 2023.
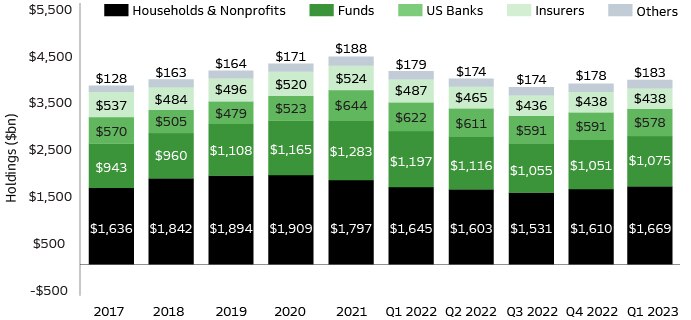
Source: Federal Reserve Board Flow of Funds data, BofA Merrill Lynch Global Research. As of 1Q23, latest available.
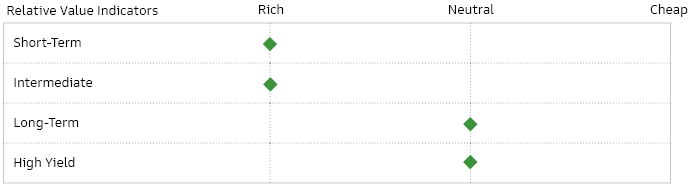
Triple-A tax-exempt muni yields generally rose during the first two months of the quarter — following the trajectory of the broader interest rate environment. In addition, munis underperformed due to fund outflows and lower levels of investable cash. Momentum did reverse however — yields began to fall and municipals significantly outperformed as summer approached.
The municipal market is projected to receive more cash, in the form of maturities and coupon income (~$120bn), than new bonds that will be brought into the market during June, July, and August. This net negative supply environment generally creates a strong tailwind for municipal bond performance.
AAA tax-exempt municipal yields increased 51/39/27/19bp in 2/5/10/30-year tenors while Treasuries increased 87/58/37/21bp in the same maturity spots on the curve. Muni/UST ratios were unchanged, with 2/5/10/30-year ratios remaining at 59/62/66/91%.
1-year municipals are yielding more than 10-year munis — a phenomenon that up until late last year had not previously occurred in the muni market. This relationship continues and is even more pronounced as the 1-year yield increased by 54bp while the 10-year only increased by 27bp. A 1-year muni outyields a 10-year muni by 46bp. By way of comparison, a 1-year UST is outyielding a 10-year UST by more than 150bp.
The difference between 2 and 30-year tax-exempt muni yields decreased by 32bp to end the quarter with a slope of 60bp. The middle of the curve, represented by 5 to 10-year maturities, flattened by 12bp and finished with a slope of -6bp.
Source: BVAL Muni. As of June 30, 2023.
The Bloomberg Municipal Bond Index returned -0.10% during 2Q’23. The 1-10 Year Blend Index posted a total return of -0.53%, while the 3-year Index returned -0.45%.
Within investment grade credit, the ‘BBB’ portion of the muni index had the best relative returns at 0.72%. From a curve perspective, the 22+year Index performed the best with a return of 0.67%.
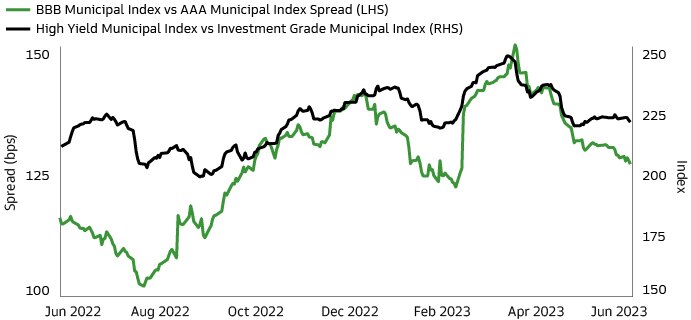
BBB-AAA credit spreads tightened by 16bps to end the quarter at 127bps. Lower-rated municipals generally benefited from the spread tightening that occurred in most risk asset classes as debt ceiling concerns abated and economic data suggested that there was no imminent recession on the horizon.
The high yield municipal market, represented by the Bloomberg Municipal High Yield Index, posted a return of 1.65% over the quarter. The Bloomberg Municipal High Yield Index outperformed the investment grade index by 175bp —marking the first time it has outperformed since the fourth quarter of 2021.
Within high yield municipals, Puerto Rico and Transportation credits were the best performers — posting total returns of 5% and 4% for Q2’23. Housing and Hospital sector credits were relative underperformers, returning -0.59% and -0.10% over the quarter. The hospital sector is showing signs of stabilization as margins are beginning to show improvement. The improvement has been driven by growth in patient volumes, decreasing length of stay, and work being done by management teams to address staffing issues. Despite this positive trend, the sector’s profitability continues to be below pre pandemic levels and liquidity levels have declined materially from their 2021 peak.
Within the HY municipal index, the longest maturity portions outperformed — returning ~2%, while the shorter maturity, 1-year, underperformed at -0.16%.
High yield spreads decreased by 24bp on the quarter and ended June at 219bp — a reversal of the spread widening seen throughout 2022 and Q1 2023. Better-than-expected data points around the labor market, the consumer, and the economy increased the likelihood of a soft landing and lessened the odds of a recession. This type of economic scenario generally bodes well for risk asset classes such as high yield municipals.
Source: Bloomberg. As of June 30, 2023.
The taxable municipal market, as represented by the Bloomberg Taxable Muni Index, posted a total return of -0.43% during Q2 ‘23. Negative returns were driven by the general increase in interest rates. Credit spreads tightened by 10bp as the spread of the Bloomberg Taxable Municipal Index compared to the 10-year Treasury ended the quarter at 122bp. The persistent theme for the taxable municipal market continues to be the dramatic slowdown in new issuance as elevated absolute Treasury yields inhibit refinancing activity. Year-to-date- taxable issuance volumes are 40% below last year’s levels.
Source: Bloomberg, Goldman Sachs Asset Management. As of June 30, 2023.
OAD: “Option adjusted duration” is a measure of the sensitivity of a bond's price to interest rate changes, assuming that the expected cash flows of the bond may change with interest rates. YTW: “Yield to worst” is calculated by making worst-case scenario assumptions (excluding issuer default) on the bond by calculating the returns that would be received if provisions, including prepayment, call, put, and sinking fund, are used by the issuer. YTW may be the same as YTM, but never higher. YTW does not represent the performance yield for the Fund. TEY: “Taxable equivalent yield” is the return that is required on a taxable investment to make it equal to the return on a tax-exempt investment.
Past performance does not guarantee future results, which may vary. Goldman Sachs does not provide accounting, tax or legal advice. Please see additional disclosures at the end of this document. Past correlations are not indicative of future correlations, which may vary. Returns less than 12 months are cumulative, not annualized.
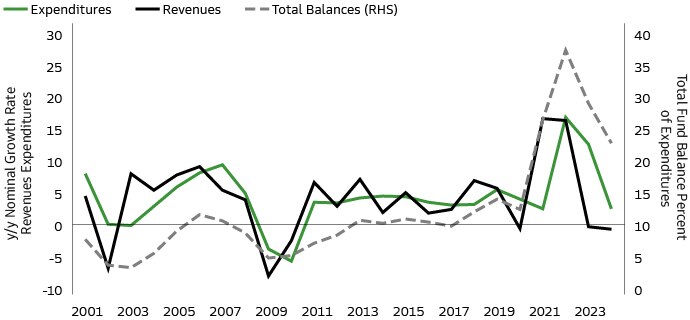
Fiscal ‘23 saw a return to more normalized revenue trends and with the COVID funding years in the rear-view mirror, actual revenues are returning to more normalized levels. However, spending, which for most governments rises with revenues, is typically not as malleable on the way down — it is far more difficult for many states and localities to reduce spending to the more normalized revenue levels. Some states (eg. Texas) are better at cutting spending more dramatically and quickly than other states (eg. California).
The good news is that for this economic and revenue cycle, states and locals are sitting on the deepest reservoir of cash reserves ever — thanks to enhanced federal funding received related to the covid shutdown. These reserves will soften the blow of moderating revenue and elevated expenses (Exhibit 7).
There has been significant coverage in the popular press regarding the decline in state and local revenues — some have even proffered doom and gloom for municipal finance. How many years will these excess reserves last and when will governments bring expenses back in line with recurring revenue and trend line? Our view remains that over extended periods, and through recessions, major weather events and now pandemics — municipal finance remains stable and fairly range-bound.
Source: National Association of State Budget Officers Spring 2023, BEA
Fiscal year 2023 revenues are expected to be $205.7bn — moderating down 11.6% from a strong FY'22. Key financial metrics remain strong with reserves at 25.25% of revenues. EOY reserves are expected to reach a robust $51.94bn — a 2.55% calculated reserve surplus with the state's Rainy Day Fund at its institutional cap.
California’s May Revision to the Governor’s Budget projected a $31.5bn budget gap for FY'24, due to lower-than-expected general fund revenues. Income taxes, the state’s largest revenue stream, are expected to come in 3.75% lower than FY’23 levels. The budget plan includes spending reductions and delays to help close the gap — mostly focused on unspent funds as opposed to large cuts to programs. Importantly, the state is coming off a period of multi-year growth and projects strong EOY reserves for 2024 in excess of $37bn — a healthy 17.79% of revenues.
Fiscal year 2023 (March-31) ended with $235bn in All Funds Receipts — up 3.5% y/y along with a $10bln increase in Fund Balance to $43.4bn. That reserve is extremely high at over 18% of “all funds budgets” and provides an ample cushion for fiscal year 2024. Furthermore, the state was able to lower debt by some $6bn, which provides greater budget flexibility that will be increasingly more significant as budget gaps materialize.
The fiscal 2024 budget calls for $224bn in All Funds Receipts —down 4.6% y/y. Headline spending of $229bn is up 4% y/y and there is a corresponding $4bn decline in total fund balance to $39.5bn. The budgeted funds drawdown is fairly modest to date and as a result it is reasonable to think that a larger drawdown is likely. New York State does however have ample reserves to rely on that would help bridge gaps versus introducing mid-year spending cuts.
Ultimately, we will be tracking the state budget performance, the magnitude of any additional drawdown and budgetary measures necessary as the 2025 budget process unfolds in early 2024.
New Jersey’s FY 2023 financial performance remained strong overall despite nominal downward revisions to revenue collection projections in Spring 2023. Total FY’23 General Fund revenues were projected to be $52.8bn, or 5% higher than FY’22 collections — driven in large part by continuing growth in sales tax revenues. Initial mid-year projections anticipated revenues increasing even further, but slightly softening income tax collections in April-May ultimately led to flat year-over-year income tax collections. Reserve levels still increased, however, by almost $1bn in FY’23 to $8.5bn, or 15.5% of the budget.
The FY 2024 budget was enacted with a nominal budget gap of $1.5bn due in large part, to several negotiated expenditure additions at the end of the budget making process, as well as marginally (~$1bn) lower than originally anticipated revenue projections. The State is currently projecting $52.8bn in total General Fund revenues in FY’24, effectively flat year-over-year, compared with $54.3bn in expenditures. The Governor and Legislature agreed to close the FY’24 gap with “excess” reserves from prior years — the projected reserve level of ~$8bn, remains roughly 15% of the budget. Notably, NJ has continued to make its full annual pension contribution and continues to appropriate, albeit lower ($400mm), funds to its Debt Defeasance Fund.
New York City’s FY’24 budget, submitted to the NYC Financial Control Board on 6/30/23, projects a second consecutive year of declining budget stabilization funds. The report shows the city ended FY 6/30/23 with revenues up 4% y/y to $110.8bn, expenditures up 4.4% to $111.4bn and a $600mm decline in budgetary reserves to $5.4bn or 4.9% of revenues. The city’s FY’24 adopted budget calls for 3% lower revenues of $107bn, no change in the $111bn budgeted expenses, and further declines in budgetary reserves to $1.5bn, which is just 1.4% of budgeted revenues. A critical component of NYC’s credit quality is the strong oversight structure, including annual 5-year forecasts — the most recent forecast shows a higher but manageable 7.3% forecasted budget deficit in FY’27. For context, this often-cited “out year budget gap” is typically in the 2-5% range. As an example, the 2017 report projected a 2.4% deficit in FY’21, while the actual results in FY’21 show a budget surplus as the city grew its budget stabilization funds (used to prepay subsequent years debt service) to $6.1bn from $3.8bn that year.
After a banner FY‘22 (6/30), the State of Illinois’ positive financial trends continued in FY’23. Through 11 months of FY’23, Illinois general fund receipts were tracking up 1.1% year-over-year, excluding ARPA funds, while management expects that the state’s Budget Stabilization Fund will finish the year in excess of $2bn – up from ~$750mm in FY‘22 and just ~$6mm in FY‘21.
The state’s more than $50bn FY’24 enacted budget calls for negligible year-over-year revenue growth, another increase to its general fund reserves and the third consecutive year of supplemental pension contributions — in excess of the state’s statutorily required amounts.
The State of Texas’s Biennial August 31 Year-End budget is anticipating a strong $32.7bn surplus — 25% higher than the prior cycle and the highest on record. The main drivers of the surge include ending of COVID restrictions, a spike in energy prices, and the highest inflation in over 40 years. It also reflects savings carried forward from 2021 from the use of pandemic-related funds and a reduction in costs for school programs given the higher-than-expected growth in local school property tax revenue. Biennial General revenues are expected to conclude at $149bn, 8% higher than the prior budget. Biennial Expenditures are expected to end at $116.3bn, a decline of 9%. The rainy day funds balance for Fiscal Year End ‘23 is expected to end with a healthy $13.7bn.
For Fiscal Year ‘24-’25, the state is expected to have $188.2bn in funds available for general-purpose spending — a 26.3% increase from the 2022-23 biennium. Biennial General revenues are projected to be $165.9bn (+11% from prior biennium). The rainy day fund balance is anticipated to be about $27.1bn by the end of Fiscal Year End ‘24-’25 biennium — almost twice as large as the prior biennial budget and at the constitutional limit. The strong gain in the rainy day funds is driven by an anticipated $10.2bn reserved from 2024-25 oil and natural gas tax collections for transfers to the fund and to the State Highway Fund. Fiscal Year End ‘24 specifically is anticipating General Revenue-Related Funds to be $81.12bn (1% higher YoY) and Fiscal Year End ‘25 is projecting $84.78bn (+4.5% YoY).
Muni Market Quarterly 2Q2023: Maintaining Resilience, Then Finishing Strong

Committed to providing you with the insights you need to build your practice.
THIS MATERIAL DOES NOT CONSTITUTE AN OFFER OR SOLICITATION IN ANY JURISDICTION WHERE OR TO ANY PERSON TO WHOM IT WOULD BE UNAUTHORIZED OR UNLAWFUL TO DO SO.
Although certain information has been obtained from sources believed to be reliable, we do not guarantee its accuracy, completeness or fairness. We have relied upon and assumed without independent verification, the accuracy and completeness of all information available from public sources.
The portfolio risk management process includes an effort to monitor and manage risk, but does not imply low risk.
Risk Considerations
Municipal Securities are subject to credit/default risk, interest rate risk and certain additional risks.
High-yield, lower-rated securities involve greater price volatility and present greater credit risks than higher-rated fixed income securities.
Investments in fixed-income securities are subject to credit and interest rate risks. Bond prices fluctuate inversely to changes in interest rates. Therefore, a general rise in interest rates can result in the decline in the bond’s price. Credit risk is the risk that an issuer will default on payments of interest and principal. All fixed income investments may be worth less than their original cost upon redemption or maturity.
Income from municipal securities is generally free from federal taxes and state taxes for residents of the issuing state. While the interest income is tax-free, capital gains, if any, will be subject to taxes. Income for some investors may be subject to the federal Alternative Minimum Tax (AMT).
Past performance does not guarantee future results, which may vary. The value of investments and the income derived from investments will fluctuate and can go down as well as up. A loss of principal may occur.
Views and opinions expressed are for informational purposes only and do not constitute a recommendation by Goldman Sachs Asset Management to buy, sell, or hold any security. Views and opinions are current as of the date of this presentation and may be subject to change, they should not be construed as investment advice.
Economic and market forecasts presented herein reflect a series of assumptions and judgments as of the date of this presentation and are subject to change without notice. These forecasts do not take into account the specific investment objectives, restrictions, tax and financial situation or other needs of any specific client. Actual data will vary and may not be reflected here. These forecasts are subject to high levels of uncertainty that may affect actual performance. Accordingly, these forecasts should be viewed as merely representative of a broad range of possible outcomes. These forecasts are estimated, based on assumptions, and are subject to significant revision and may change materially as economic and market conditions change. Goldman Sachs has no obligation to provide updates or changes to these forecasts. Case studies and examples are for illustrative purposes only.
Goldman Sachs does not provide legal, tax or accounting advice, unless explicitly agreed between you and Goldman Sachs (generally through certain services offered only to clients of Private Wealth Management). Any statement contained in this presentation concerning U.S. tax matters is not intended or written to be used and cannot be used for the purpose of avoiding penalties imposed on the relevant taxpayer. Notwithstanding anything in this document to the contrary, and except as required to enable compliance with applicable securities law, you may disclose to any person the US federal and state income tax treatment and tax structure of the transaction and all materials of any kind (including tax opinions and other tax analyses) that are provided to you relating to such tax treatment and tax structure, without Goldman Sachs imposing any limitation of any kind. Investors should be aware that a determination of the tax consequences to them should take into account their specific circumstances and that the tax law is subject to change in the future or retroactively and investors are strongly urged to consult with their own tax advisor regarding any potential strategy, investment or transaction.
This information discusses general market activity, industry or sector trends, or other broad-based economic, market or political conditions and should not be construed as research or investment advice. This material has been prepared by Goldman Sachs Asset Management and is not financial research nor a product of Goldman Sachs Global Investment Research (GIR). It was not prepared in compliance with applicable provisions of law designed to promote the independence of financial analysis and is not subject to a prohibition on trading following the distribution of financial research. The views and opinions expressed may differ from those of Goldman Sachs Global Investment Research or other departments or divisions of Goldman Sachs and its affiliates. Investors are urged to consult with their financial advisors before buying or selling any securities. This information may not be current and Goldman Sachs Asset Management has no obligation to provide any updates or changes.
Valuation levels for the assets listed in the Account statements and other documents containing prices reflect Goldman Sachs Asset Management’s good faith effort to ascertain fair market levels (including accrued income, if any) for all positions. The valuation information is believed by Goldman Sachs Asset Management to be reliable for round lot sizes. The prices are indicative only of the assumed fair value of the positions on the relevant date. These valuation levels may not be realized by the Account upon liquidation. Market conditions and transaction size will affect liquidity and price received upon liquidation. Current exchange rates will be applied in valuing positions in foreign currency.
For portfolio valuation purposes it is the responsibility of the custodian, administrator or such other third party appointed by the client, to obtain accurate and reliable information concerning the valuation of any securities including derivative instruments which are comprised in the portfolio. The information that Goldman Sachs Asset Management provides should not be deemed the official pricing and valuation for the Account. Goldman Sachs Asset Management is not obligated to provide pricing information to satisfy any regulatory, tax or accounting requirements to which the Client may be subject.
Index Benchmarks
Indices are unmanaged. The figures for the index reflect the reinvestment of all income or dividends, as applicable, but do not reflect the deduction of any fees or expenses which would reduce returns. Investors cannot invest directly in indices.
The indices reference herein have been selected because they are well known, easily recognized by investors, and reflect those indices that the Investment Manager believes, in part based on industry practice, provide a suitable benchmark against which to evaluate the investment or broader market described herein.
Municipal 3 yr: Bloomberg Municipal 3 Year Index
The Bloomberg Municipal Bond Index is a rules-based, market-value-weighted index engineered for the long-term tax-exempt bond market. To be included in the index, bonds must be rated investment-grade (Baa3/BBB- or higher) by at least two of the following ratings agencies: Moody's, S&P, Fitch. If only two of the three agencies rate the security, the lower rating is used to determine index eligibility. If only one of the three agencies rates a security, the rating must be investment-grade. They must have an outstanding par value of at least $7 million and be issued as part of a transaction of at least $75 million. The bonds must be fixed rate, have a dated-date after December 31, 1990, and must be at least one year from their maturity date. Remarketed issues, municipal bonds, bonds with floating rates, and derivatives, are excluded from the benchmark. This index is the 3 Year (2-4) component of the Municipal Bond index.
Municipal 1-10yr Blend: Bloomberg Municipal 1-10 Yr Blend Index
The Bloomberg Municipal Bond 1-10 Year Blend Index is a market value-weighted index which covers the short and intermediate components of the Bloomberg Municipal Bond Index, an unmanaged, market value-weighted index which covers the U.S. investment-grade tax-exempt bond market. The Bloomberg Municipal Bond 1-10 Year Blend Index tracks tax-exempt municipal General Obligation, Revenue, Insured, and Prerefunded bonds with a minimum $5 million par amount outstanding, issued as part of a transaction of at least $50 million, and with a remaining maturity from 1 up to (but not including) 12 years. The index includes reinvestment of income.
Municipal Aggregate: Bloomberg Aggregate Municipal Index
The Bloomberg Municipal Bond Index is a rules-based, market-value-weighted index engineered for the long-term tax-exempt bond market. To be included in the index, bonds must be rated investment-grade (Baa3/BBB- or higher) by at least two of the following ratings agencies: Moody's, S&P, Fitch. If only two of the three agencies rate the security, the lower rating is used to determine index eligibility. If only one of the three agencies rates a security, the rating must be investment-grade. They must have an outstanding par value of at least $7 million and be issued as part of a transaction of at least $75 million. The bonds must be fixed rate, have a dated-date after December 31, 1990, and must be at least one year from their maturity date. Remarketed issues, taxable municipal bonds, bonds with floating rates, and derivatives, are excluded from the benchmark.
Municipal High Yield: Bloomberg High Yield Municipal Index
The Bloomberg Municipal High Yield Bond Index is an unmanaged index made up of bonds that are non-investment grade, unrated, or rated below Ba1 by Moody's Investors Service with a remaining maturity of at least one year. The Index figures do not include any deduction for fees, expenses or taxes. It is not possible to invest directly in an unmanaged index.
Taxable Municipal: Bloomberg Taxable Municipal Index
The Bloomberg Taxable Municipal Bond Index is a rules-based, market-value-weighted index engineered for the long-term taxable bond market. To be included in the index, bonds must be rated investment-grade (Baa3/BBB- or higher) by at least two of the following ratings agencies if all three rate the bond: Moody's, S&P, Fitch. If only two of the three agencies rate the security, the lower rating is used to determine index eligibility. If only one of the three agencies rates a security, the rating must be investment-grade. They must have an outstanding par value of at least $7 million and be issued as part of a transaction of at least $75 million. The bonds must be fixed rate and must be at least one year from their maturity date. Remarketed issues (unless converted to fixed rate), bonds with floating rates, and derivatives, are excluded from the benchmark.
Goldman Sachs does not provide legal, tax or accounting advice, unless explicitly agreed between you and Goldman Sachs (generally through certain services offered only to clients of Private Wealth Management). Any statement contained in this presentation concerning U.S. tax matters is not intended or written to be used and cannot be used for the purpose of avoiding penalties imposed on the relevant taxpayer. Notwithstanding anything in this document to the contrary, and except as required to enable compliance with applicable securities law, you may disclose to any person the US federal and state income tax treatment and tax structure of the transaction and all materials of any kind (including tax opinions and other tax analyses) that are provided to you relating to such tax treatment and tax structure, without Goldman Sachs imposing any limitation of any kind. Investors should be aware that a determination of the tax consequences to them should take into account their specific circumstances and that the tax law is subject to change in the future or retroactively and investors are strongly urged to consult with their own tax advisor regarding any potential strategy, investment or transaction.
Confidentiality
No part of this material may, without Goldman Sachs Asset Management’s prior written consent, be (i) copied, photocopied or duplicated in any form, by any means, or (ii) distributed to any person that is not an employee, officer, director, or authorized agent of the recipient.
Date of First Use: 4/10/2023. Compliance Code: 326766-OTU-1834287
